 २२.१२°C काठमाडौं
Average inflation over 50 years 8.32 percent, highest for food

We use Google Cloud Translation Services. Google requires we provide the following disclaimer relating to use of this service:
This service may contain translations powered by Google. Google disclaims all warranties related to the translations, expressed or implied, including any warranties of accuracy, reliability, and any implied warranties of merchantability, fitness for a particular purpose, and noninfringement.

Highlights
- The average inflation rate has been falling in recent decades due to Indian inflation, domestic output levels and fluctuations in inflation due to weather.


According to the study of Rashtra Bank, the average price increase rate (inflation) in Nepal in the last five decades is 8.32 percent. According to the National Bank of India, although there were many fluctuations in the price increase during that period, it remained at a single digit (8.5 percent) on average. National Bank has conducted such a study for the first time.


In the last five decades, the prices of vegetables, pulses and pulses, sugar, alcohol, etc. under the food and beverage group have seen a slight increase. However, under the non-food and service group, the price of goods and services such as education, clothing, footwear, communication, and other goods and services are relatively low.
Prakash Kumar Shrestha, head of research department of Rashtra Bank, said that the average inflation rate of Nepal during that period was moderate. "Recently, the average inflation rate has decreased," he said. After that, the target and limit of price increase also started to be set. In the last decade, inflation calculation and target setting have improved in many aspects, he said.
The last 50 years period has been analyzed by classifying it into three phases. The financial years 1973/74 to 1989/90 are classified as the beginning of economic liberalization, 1990/91 to 2005/06 the promulgation of a new constitution and 2006/07 to 2022/23 post-democratic movement. In the first 16 years covered by the


study, the country's average price increase rate is 9.88 percent, while the average price increase of the food and beverage group is 10.09 percent and the non-food and service group is 9.69 percent. At the beginning of the first phase, the price increase was double-digit due to the increase in the price of petroleum products and the increase in money supply through credit expansion. After that, the overall price increase was reduced due to favorable weather for bringing crops into the country, decrease in price increase in India, strict policy on credit expansion.
By the second phase, the average inflation rate was 7.64 percent. During that period, the average price increase of the food and beverage group is 7.46 percent and that of the non-food and service group is 7.76 percent. This shows that the average inflation rate has decreased in the second phase compared to the first phase. However, the average inflation rate in 1991/92 was 21.05 percent.
At that time, due to the adoption of the current account conversion policy by the government, the value of the Nepali rupee was depreciated (decreased) compared to the US dollar and other convertible foreign currencies. With the beginning of economic liberalization, the government started fixing the maximum price of various goods and services including milk, petroleum products, education fee, telephone fee and electricity, and the rate of price increase decreased.
In the years since 1991/92, the inflation rate appears to have been effectively controlled. In the following five fiscal years, the average inflation rate of Nepal was less than 5 percent. In the year 2000/01, the average inflation rate of Nepal was 2.43 percent. At that time, the price increase was low due to the decrease in the price increase rate in India, and the increase in agricultural production in Nepal due to favorable weather.
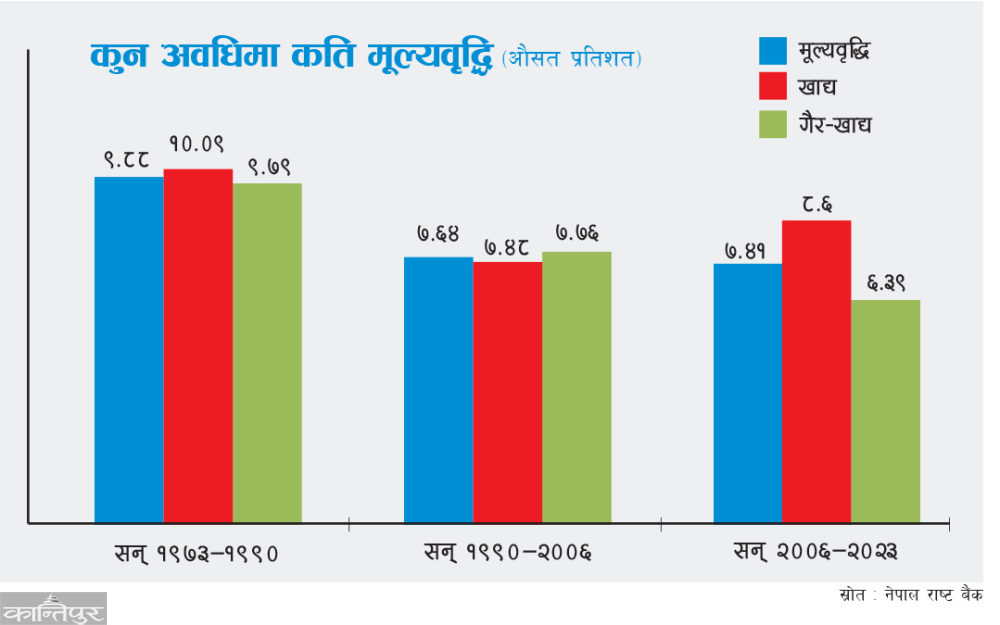
Similarly, the average price growth rate of Nepal from 2006/07 to 2022/23 was 7.41 percent. During that period, the average price increase of the food and beverage group is 8.60 percent and that of the non-food and service group is 6.39 percent. During that period, significant events have been seen in the area of price increase.
In 2008/09, the average inflation rate was 12.63 percent. Due to load-shedding, political agitation, workers' movement in industries, businessmen's cartelization, prices reached double digits at that time.
However, the average price increase in 2015/16 fell to a single digit 9.93 per cent. At the same time, due to natural disasters such as devastating earthquakes, floods and landslides in Nepal, the report showed that the price increase rate of food and non-food subgroups was in double digits for a few years at that time. However, it has been shown that the inflation rate has been decreasing in the last decade compared to the previous five decades. The
study showed that the average inflation rate in 2022/23 was 7.74 percent. The food and beverages group contributed the most in the average price increase of the period at 36.3 percent. The report pointed out that during that period, household materials contributed 24.2 percent, transportation 8.7 percent, education 9 percent and others about 22 percent. Overall, the contribution of the food and beverage group to the total price increase seems to be high.
According to the monthly report of Rastra Bank, the annual point consumer price increase rate in May 081 is 4.17 percent. In the same period of the previous year, such rate was 6.83 percent. During that period, the price increase rate of food and beverages group is 5.76 percent and that of non-food and services group is 2.94 percent. Under this group, the annual point price index of vegetable sub-group has increased by 16.02, pulses and pulses by 11.76, food and food products by 7.32, sugar and sugar products by 6.98 and non-alcoholic beverages by 5.95 percent. During this period, the annual point price index of ghee and oil subgroup decreased by 5.51 percent.
Last May, the annual point price index of miscellaneous goods and services sub-group under the non-food and service group increased by 12.47 percent, education by 5.64 percent, and clothing and footwear by 3.46 percent. However, the annual point price index of communication sub-group decreased by 0.48 percent and transportation by 0.18 percent, the report said. In May 081, the annual point consumer price increase rate of Kathmandu Valley is 4.25 percent, Terai 3.82 percent, Hills 4.63 percent, and Himals 4.77 percent. In the same month of last year, the price increase rate of Kathmandu Valley was 7.19 percent, Terai 6.93 percent, Hills 6.28 percent and Himals 6.39 percent.
Similarly, the annual point wholesale price increase rate (inflation) is 5.48 percent in May 081. In the same month last year, the rate of increase was 3.10 percent. Last May, consumer goods 6.87, intermediate goods 5.32 and capital goods 1.66 annual point wholesale inflation is 6.87, 5.32 percent and 1.66 percent respectively. In the month under review, the annual point wholesale inflation of construction materials decreased by 2.12 percent.
 प्रकाशित : श्रावण १०, २०८१ ०९:१९


