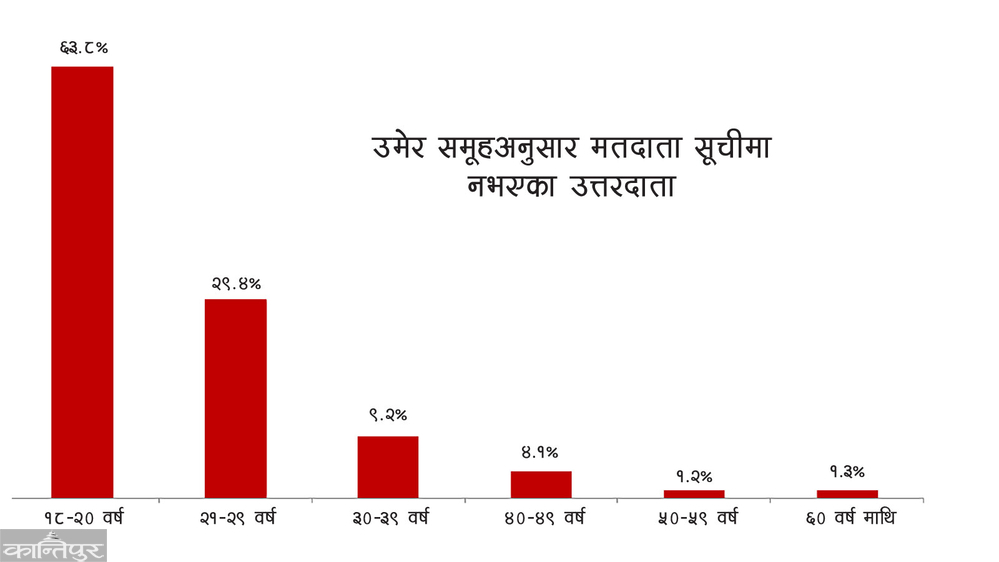
14.6 percent of those aged 18-20 who participated in the survey said they did not have a voter ID card. Among respondents in the 18-20 age group, 64 percent do not have a voter ID card.
We use Google Cloud Translation Services. Google requires we provide the following disclaimer relating to use of this service:
This service may contain translations powered by Google. Google disclaims all warranties related to the translations, expressed or implied, including any warranties of accuracy, reliability, and any implied warranties of merchantability, fitness for a particular purpose, and noninfringement.
The general public is enthusiastic about the upcoming House of Representatives elections on 21 Falgun. In a nationwide survey conducted over a month, 83 percent of voters have expressed their desire to vote.*
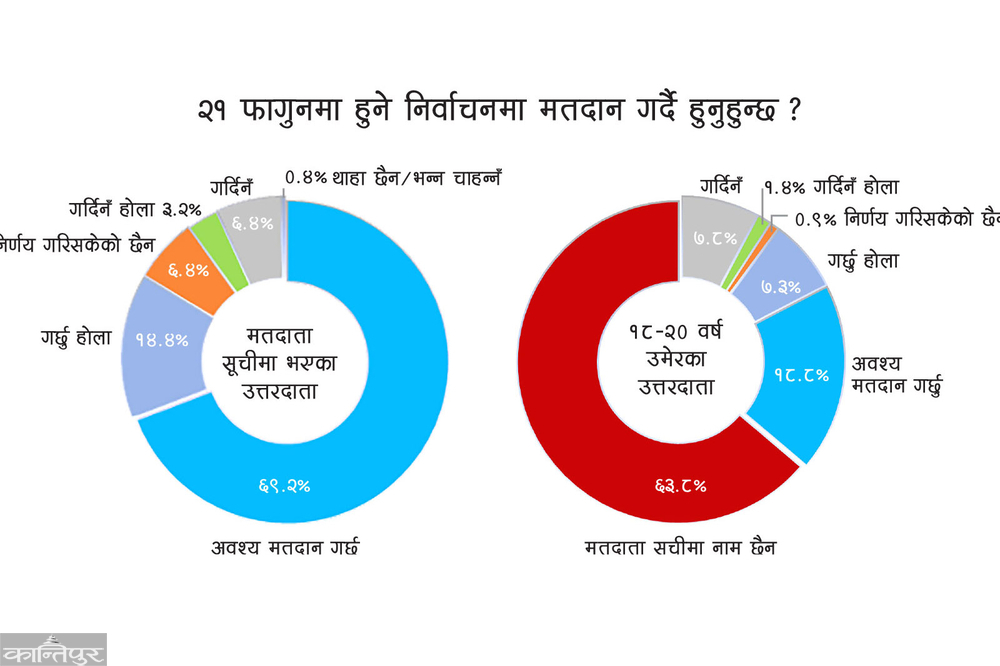
In a survey conducted in collaboration with Kantipur Media Group and Sharecast Initiative Nepal, 69.2 percent of respondents with voter ID cards said they would definitely vote this time. An additional 14.4 percent have expressed their desire to vote. While 9.6 percent have expressed their reluctance to vote.
116 wards of 102 municipalities in 45 districts were selected for the survey. 2905 people were interviewed there and the survey report was prepared based on their responses. 38 enumerators were mobilized in 19 groups in the survey, which lasted for a month from 17 Pus to 17 Magh. Nepali citizens aged 18 to 70 were selected for the interviews.
The election is being held on 21 Falgun, less than 3 years and 3 months after the previous House of Representatives elections. The new elections were announced after the Gen-G uprising of 23-24 Bhadra displaced the then government along with the House of Representatives. Looking at the responses of the respondents in the opinion poll, it seems that there is a possibility of enthusiastic participation in the upcoming elections. According to the Election Commission, there are a total of 18.9 million 3 thousand 689 voters this time.

The number of respondents who are sure and intend to vote is 83.6 percent. 6.4 percent said that they have not decided during the survey period. Similarly, only 6.4 percent said that they will not vote, while 3.2 percent said that they are likely to not vote. 0.4 percent did not want to answer.
In the 2079 election, 61.41 percent voted and in 2074, 68.67 percent voted. In the second Constituent Assembly election of 2070, 78.34 percent voted. In the first Constituent Assembly election of 2064, 61.70 percent voted.
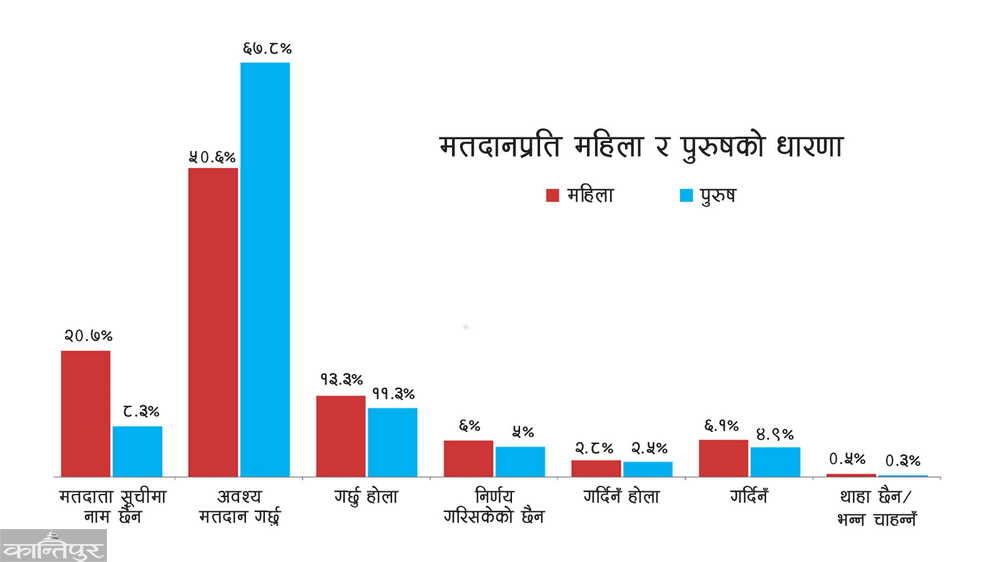
14.6 percent of the respondents who were of age and participated in the survey responded that they did not have a voter ID card. 64 percent of respondents in the 18-20 age group do not have voter ID cards. 29 percent of those in the 21-29 age group said they do not have voter ID cards. In this way, a large number of young voters have been left out of the vote this time, despite being eligible to vote, due to the lack of preparation by the government and the Election Commission and the lack of initiative by political parties. Twice as many women as men in the survey do not have voter ID cards. 8.3 percent of male and 20.7 percent of female respondents said they were not on the voter list. Even in the case of exercising their right to vote, there are more men than women. While 50.6 percent of female respondents said they would ‘definitely’ vote, the percentage of such men is 67.8. This election is the first for 16.4 percent of respondents who are preparing to vote this time. 70 percent of voters have already voted twice. Similarly, 47.5 percent have voted three or more times. 8.3 percent of voters are more attracted to ‘mid-career leadership’. More than 60 percent of voters have shown interest in candidates in the age group of 35-45 years. Candidates above 60 years are very few in the voters' choice. Only 1.7 percent of voters have expressed their interest in candidates above 60 years.
Similarly, the interest of voters in candidates below 35 years is not encouraging. 11.2 percent of voters have shown interest in candidates in this age group. 3,406 candidates have registered their nominations from across the country for the upcoming elections. Generational change in politics was one of the main demands of the Gen-G movement held in Bhadau. However, a look at the list of candidates shows a majority of candidates of the older age group.
52 percent of voters are in the age group of 18 to 40 years, while only 31 percent of candidates in this age group are. Similarly, 56 percent of candidates are in the age group of 41 to 60 years and 12 percent are above 60 years. Candidates under the age of 40 are 40 percent in the Rashtriya Swayamsevak Sansthan (RSS), 38 percent in the Ujjaya Nepal Party (UP), 32 percent in the Shram Sanskriti Party (SSP), 8 percent in the NCP, 7 percent in the UML, and a total of 4 percent in the Congress. 937,094 new voters have been added within the time given by the Election Commission in October for compiling the voter list. The compilation process was stopped when the pressure to register names in the voter list was still high.
Commission spokesperson Narayan Prasad Bhattarai claims that since names are being compiled in the voter list regularly, it is unlikely that a large number of people who have reached the age of majority are left out of the list. 'The compilation of the voter list is a regular process, and voter participation has increased since it is digitalized,' he said.
The commission, however, stated that there is no exact data on those who have not been able to become voters despite reaching the age limit. Since everyone has the right to register their names in the voter list, some may not have registered their names due to their own busy schedule or lack of time, says spokesperson Bhattarai. He said that since it was easy to register in the voter list after linking it with the national identity card, many people registered their names in a short period of time. Former Secretary of the Commission Gopinath Mainali says that although the voter list collection process is digitalized and regular compared to the past, people who have migrated or do not have citizenship may not have obtained voter ID cards.
This is how the survey was conducted
In the survey on ‘Citizens’ perceptions of contemporary social, economic and political issues in Nepal, about 2,905 people from all over the country were interviewed by direct meetings.
While selecting the respondents participating in the survey, the number of respondents (sample) has been distributed based on the proportion of the number of households in all seven provinces. Members who have been living as members of a single household in the same house for the past 6 months and eating in the same kitchen have been counted as a household.
While distributing the number of households and respondents participating in the interview, it has been distributed based on the proportion of the total number of households living in rural municipalities, municipalities and metropolitan cities. The selection of districts and municipalities for the survey was done based on the PPS (Probability Proportion to Size) method.
116 wards from 102 municipalities in 45 districts were selected for the survey. While selecting households, after reaching the selected ward, a chowk was randomly selected and the houses on the right side of that chowk were selected. A list of 90 households in the rural municipality, 120 households in the municipality and 150 households in the metropolitan city were prepared from the selected toles. To determine which households to interview, in the selected wards, the total number of households listed was divided by 25, and only 25 households within that number of households were interviewed.
A list of potential respondents was prepared only for Nepali citizens aged 18 to 70 years who had resided in the selected households for at least 6 months and who could hear, understand and respond to what the enumerator said. The ‘Kiss Grid’ method has been used to determine which household member to interview. Only members selected through this method have been interviewed with prior consent. The member found at home or the person met on the way has not been interviewed. Only members selected through the scientific method of research have been interviewed.
During the survey, 38 enumerators were mobilized in 19 groups of 2/2 people from Pus 17 to Magh 17 for on-site interviews. The margin of error of the survey is +/-5 percent. The questions asked for the interview and the answers were entered into mobile/tablets using ‘Open Data Kit Software’. To ensure the quality of the data, GPS, on-site observation, on-site training and feedback have been provided to each household selected for the interview. In addition, about 15 percent of the interviews have been re-tested, while the contribution to the counter-enumerator interviews has been limited to only 2.6 percent. While selecting respondents in provinces and municipalities, the actual population ratio of 2078 was used, and gender selection was also based on the population ratio, so these variables are ‘self-weighted’.
The data analysis of the survey was done by Madhu Acharya and Bhumiraj Chapagain of Sharecast Initiative. The ‘National Public Opinion Survey-2082’ was conducted in collaboration with Kantipur and Sharecast Initiative.
Limitations of the survey
1. The answers given by the respondents during the interview are recorded as the final answers.
2. The answers may have been biased due to the respondents’ social, economic and political background or affiliation. No other controls were included in the survey to measure the fairness of the respondents’ answers, except for the supplementary questions asked in the survey.
3. The personal, family, social and economic conditions of the respondent and the relationship between them may have influenced the answers, and the survey did not analyze which questions may have had an impact.
4. Statistical research may not accurately represent the social, behavioral and qualitative aspects of people in some cases. Additional qualitative studies may be necessary to get to the root of the causes of the results. This survey does not cover the qualitative aspect.
5. Since the survey was conducted under normal conditions in the months of Pus-Magh, this survey does not project the results that will or may come under unusual or different social or political conditions.
6. The survey has accepted the responses given by 2,905 respondents living in 116 wards from 102 municipalities in 45 districts as representative responses.
7. This data does not represent Nepalis living abroad, including those under 18 years of age and over 70 years of age.
*Edited .
Other news related to the survey:
2,905 citizens from 45 districts participated in the 'National Opinion Survey'